Voronoi Diagrams
Table of Contents
Imagine a city map that colored each house differently based on the nearest post office. That map would partition the city into colored regions, which approximate a Voronoi diagram, a concept that often appears in science and engineering. These diagrams appear in the network of crystals in heated metal; the bubbles in soap foams; and disease outbreaks originating from different sources.
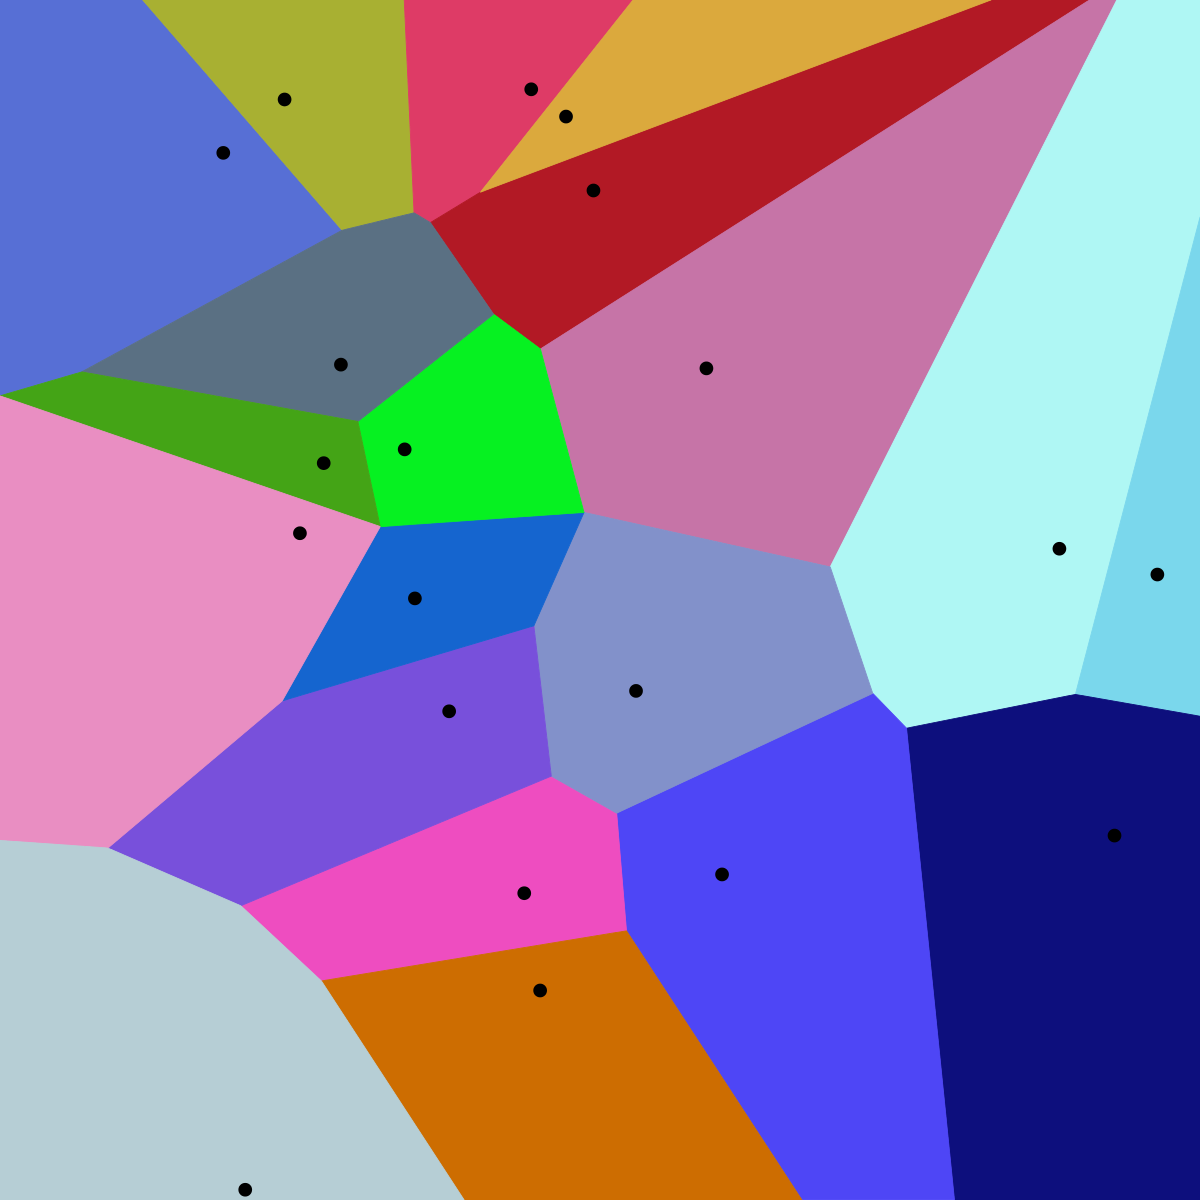
Motivated by Voronoi diagrams in the study of soap foams, I (along with my mentors at NIST) investigated the evolution of these diagrams over time. The potential energy of substances in a Voronoi format is often the surface area (or in the 2D case, perimeter). Thus, these diagrams often evolve by minimizing the total length of the boundaries of the regions (referred to as the perimeter). However, the problem becomes further complicated by requiring that none of the regions shrink and disappear, which often happens when this type of evolution is unconstrained. We can generalize the post office locations (the metaphor introduced in the first paragraph) as a collection of coordinates (referred to as sites). We are interested in an objective function whose input is the sites and whose value is the length of the perimeter of the diagram summed with an optional repulsion term, which keeps the sites from getting too close. This function is differentiable, so we can use many gradient descent methods to carry out the evolution. Interestingly, these different methods have different behavior. For example, using constant step-size gradient descent gives different behavior than using the Barzilai-Borwein method.
The objective function is highly nonlinear and nonconvex, so different methods and initial conditions yield different solutions. For each of these methods, we collect geometrical and topological statistics about the boundary network over time. Our goal is to understand how these diagrams change over time. Overall, it is important to understand the evolution of Voronoi diagrams because of the implications in metallurgy and the study of soap foams.
The source for this project can be found on github.